 Neurotime
Benchmarking
Compare your coverage with your competitors
Neurotime tracks competitor mentions with the same sources, filters and AI analysis as your own brand, so every comparison is like-for-like: who is mentioned most, where, how positively, and why.
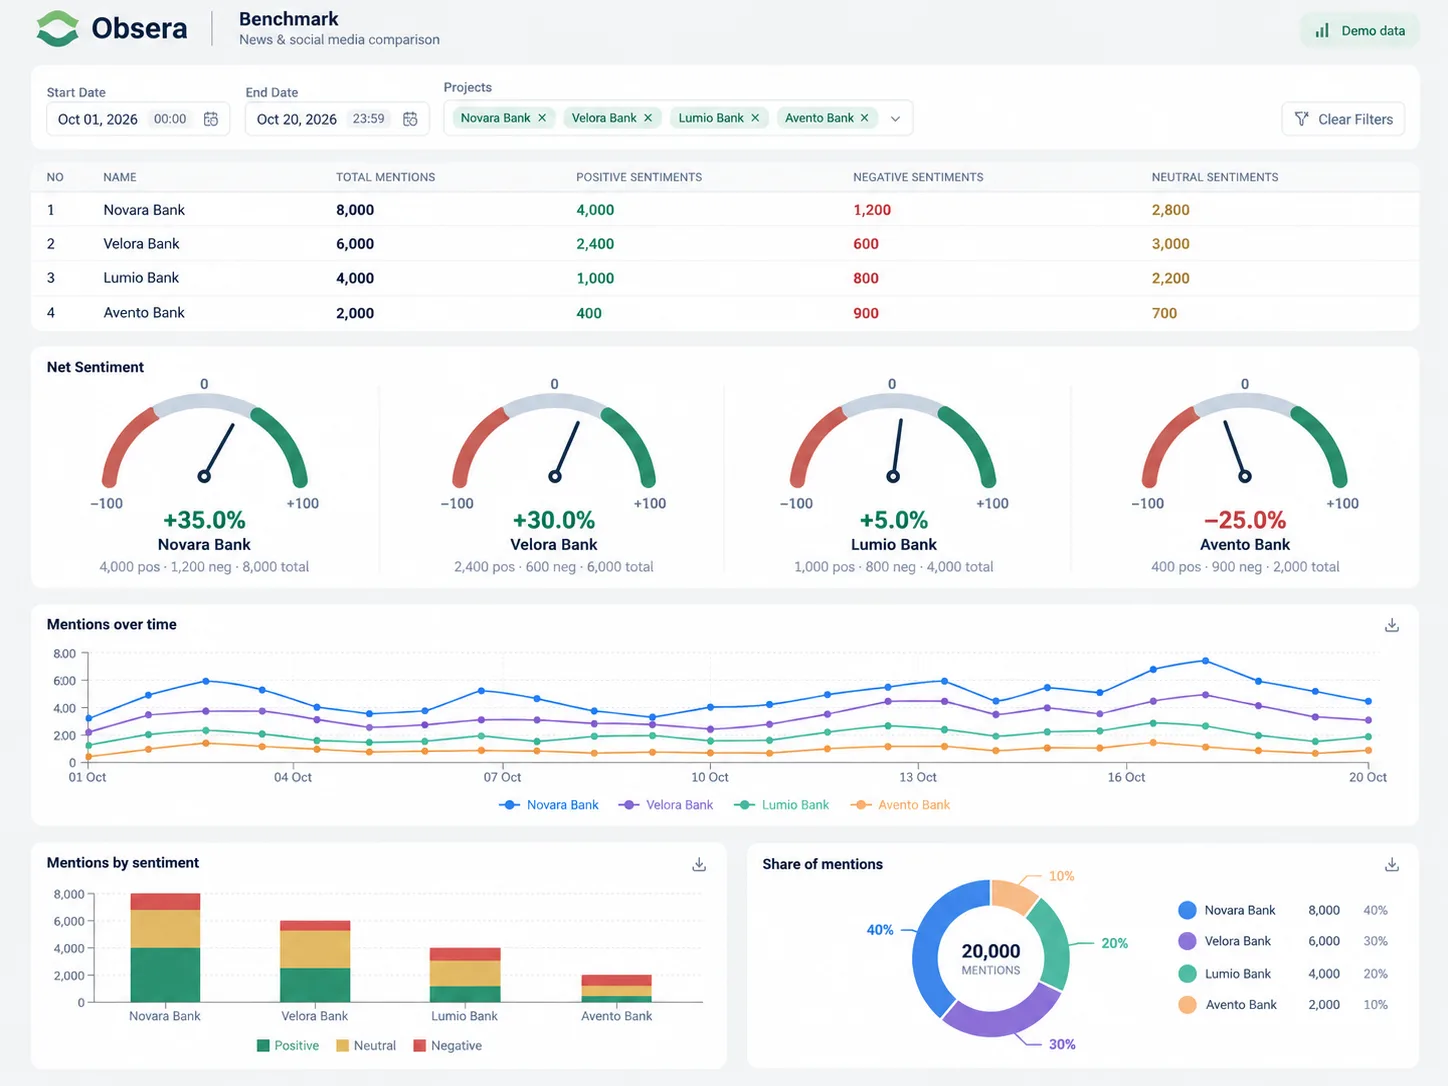
Benchmark dashboard
Your brand and your competitors on one screen
A single table ranks every brand by total mentions, positive, neutral and negative mentions, and net sentiment. Gauges show each brand's net sentiment, the timeline shows mentions over time, and share of mentions shows who owns the conversation.
Every number is filtered for relevance and calculated with the same rules for every brand, so a difference you see is a real difference — not the result of different keywords or sources.
What you can compare
Mention volume
Total relevant mentions per brand for any period, with daily, weekly or monthly trends.
Share of mentions
Each brand's share of all mentions across the selected set — your share of voice.
Sentiment and net sentiment
Positive, neutral and negative mentions, and net sentiment = (positive − negative) ÷ total.
Sources and platforms
Which news websites and social platforms drive each brand's coverage.
Topics and categories
What each brand is talked about for — products, service, app, pricing, sponsorships, leadership.
Advertising activity
With TV and radio monitoring: how often, where and when competitors advertise.
How a benchmark is set up
1
Choose the set
Your brand and the competitors you want to compare, each with spelling variants, product names and executives.
2
Use the same rules
Same sources, same period, same relevance filtering and the same AI classification for every brand.
3
Compare
Volume, trend, share of mentions, sentiment, sources and topics side by side.
4
Review regularly
Weekly or monthly benchmark reports by email, plus a live dashboard for campaigns and events.
Frequently asked questions
As many as your market needs. Most teams start with three to five direct competitors and add others for specific campaigns or segments.
Yes. Every brand is tracked with the same sources, period, relevance filtering and sentiment models, so differences reflect real coverage.
Your relevant mentions divided by the mentions of all brands in the selected set, for the same sources and period. It shows how much of the conversation your brand owns.
Net sentiment = (positive − negative) ÷ total mentions. It ranges from −100% to +100% and makes brands of different sizes comparable.
Yes. Click any brand or day to open the mentions behind the number — the articles, posts and broadcasts that caused a peak or a drop.
Yes. Benchmarks can be delivered daily, weekly, monthly or yearly by email, in any format you need.
Benchmark your brand
Name your competitors and we will show the comparison on real data in a free demo.