 Neurotime
Reports and analytics
Reports that explain coverage, not just count it
Neurotime provides dashboards, periodic reports, platform and source reports, sentiment and topic summaries, and management reports. This page defines each metric and shows example layouts.
Metrics and how they are defined
A metric is only useful if its denominator is clear.
| Metric | Definition |
|---|---|
| Mention volume | Number of relevant mentions in the period, after relevance filtering. |
| Trend | Mention volume per day, week or month across the period. |
| Platform and source breakdown | Share of relevant mentions by platform (news, Facebook, …) and by individual source. |
| Sentiment distribution | Share of relevant mentions classified positive, neutral or negative. Denominator: all relevant mentions in the period. |
| Topics | Mentions grouped by subject. Complaint categories depend on your configured topics. |
| Competitor comparison | The same metrics side by side for your brand and selected competitors. |
| Share of voice | Your relevant mentions ÷ mentions of you and the selected competitors, same sources and period. |
| Engagement and public reaction | Reactions, comments, shares or views as exposed by each platform. Not comparable across platforms. |
| Reach and views | Reach and view counts per mention and per platform, as reported by the source. |
| Campaign analysis | Mentions of campaign terms during a defined campaign window. |
| Executive summary | Short management report on the period's key coverage. |
Engagement from different platforms is not directly equivalent: a TikTok view, a Facebook reaction and a news article are different units. Reports show them separately.
Social listening report
Source, sentiment and category distribution on one page
A MediaEye report shows where the conversation happens, how people feel about it and what they talk about — with the formula behind every number.
Source distribution splits relevant mentions by news websites and each social platform. Sentiment distribution shows positive, neutral and negative shares, and net sentiment is calculated as (positive − negative) ÷ total mentions. Category distribution groups mentions into business topics such as product quality, customer service, pricing, delivery or app experience.
Every chart can be exported, and the same data is available as Excel, HTML or any custom format your team needs.
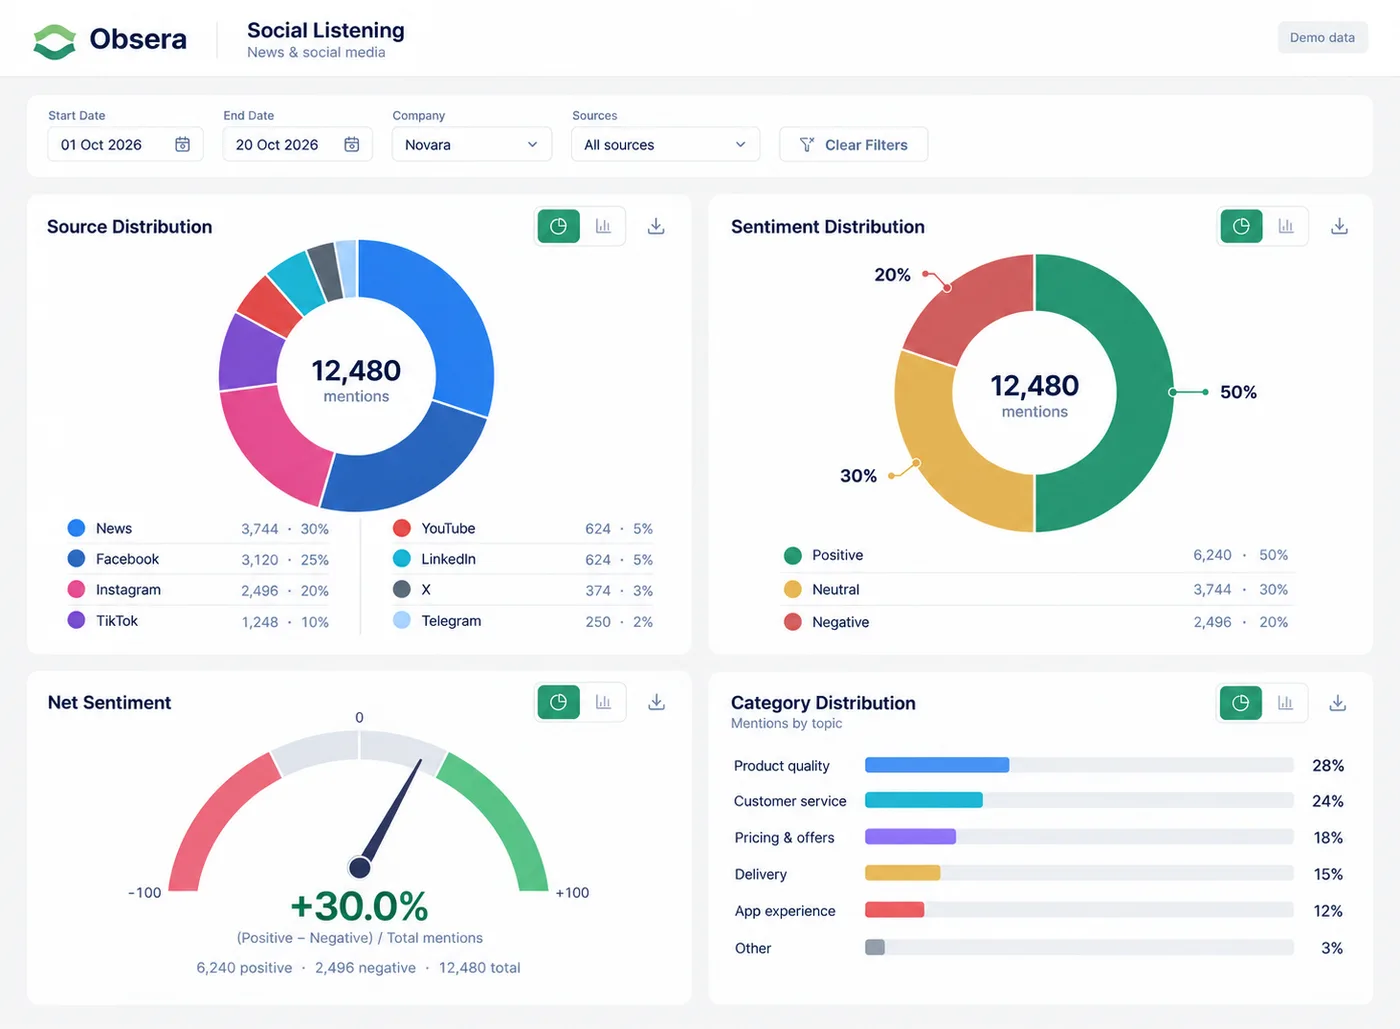
Example report layout
Illustrative sample. All figures are invented to show the layout and are not customer data.
SAMPLE DATA — NOT A REAL CUSTOMER
Relevant mentions
1,240
News websites
68%
Negative
11%
Share of voice*
34%
Report types
Dashboards
- Live view of mentions, sources and sentiment
- Filter by period, platform and topic
Periodic reports
- Daily, weekly, monthly or any agreed period
- Delivered automatically
Platform and source reports
- Which outlets and platforms drive coverage
Management reports
- Concise summary for leadership
Custom reports
- Your own layout, metrics and branding
- Any file format you ask for